
Part 1: Local
Weather Data
Guiding
Questions: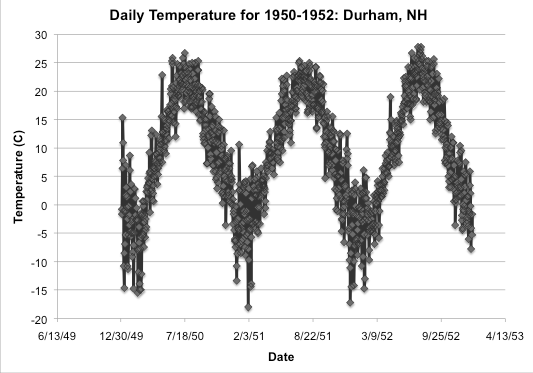
- What are the historical and/or current weather patterns or events for a location in North America?
- What are the long-term
weather patterns (i.e. climate) in this location?
Definitions:
- Weather= the mix of events (precipitation, humidity, temperature, etc.) that happen over a short period of time (minutes to months) in a specific location. For example, the temperature on June 12, 2012 in Durham, NH was 18.9°C.
- Climate = the long-term patterns of weather in a particular area. This is often measured as the average weather of a 30-year period (called a 'climate normal'). For example, over the past 30 years, the average annual temperature in Durham was 8°C.
- Climate Normal = an average of some climate
variable over a 30-year period.
Materials:
- Computers with Excel, or similar spreadsheet (one per student or student pair)
- Science notebook for recording observations (Open inquiry only)
- Frayer
Model worksheet

- Weather to Climate document
- Structured Inquiry 1 (Graphs included -no computer needed, for Boise, ID only)
- Temperature: Student
Version Teacher
Version
- Snow:
Student
Version Teacher
Version
- Structured Inquiry 2 (Students create graphs - computer with Excel, and Excel spreadsheets linked below are needed)
- Temperature: Student
Version Teacher
Version
- Snow:
Student
Version Teacher
Version
- Open Inquiry (computer with access to internet and Excel needed. This option has students download data for a location of their choice and investigate a self designed research question. Pages 1 and 2 of this worksheet could also be used for teachers to download and prepare a dataset for their students.)
- Excel spreadsheets* for Structured Inquiry 2.
- Optional for Open Inquiry:
Pre-
requisites
- Optional: Measure and record local weather data at your school.
- Some experience with Excel (unless choosing option 1 above).
Estimated Time:
- 1 - 3 hours depending on which option your students are
doing.
What to do and how to do it: Structured Inquiry
- INTRODUCTION Use the Frayer Model to initialize a discussion on the difference between weather and climate. Students can either create individual models or work in teams to come up with definitions. Have students share ideas with the class, and the teacher facilitates a discussion to clarify definitions. Briefly describe the Daymet dataset (Daymet uses computer software to extrapolate data from many weather stations to produce estimates of weather data over large regions. The data is available daily from 1980 to the present, and organized by ORNL DAAC- funded by NASA). Ask students why they think long-term records are important. Remind students they will be using metric units (°C, mm); if necessary review the difference between Celsius and Fahrenheit.
- Students, individually or in pairs, complete the Weather to Climate Investigation, using the data to answer questions. Students can choose to investigate either Temperature or Snow Depth at three possible locations (Durham, New Hampshire; Boise, Idaho; or Little Rock, Arkansas).
- Students report out findings to class in a round robin
discussion or on chart paper.
What to do and how to do it: Open Inquiry
- INTRODUCTION
Briefly discuss how to formulate a research topic and
hypothesis, using the first page of the Weather to
Climate:Daymet handout for topic suggestions.
(Optional: use the Planning Guide for Scientific
Research and The Science Notebook
Guide to help in the planning and research process).
Describe the Daymet
dataset (Daymet uses computer software to extrapolate
data from many daily meteorological observations to produce
estimates of weather data over large regions. The data is
available daily from 1980 to the present, and organized by
ORNL DAAC- funded by NASA).
- Follow the instructions in the Weather to Climate
Investigation: Open Inquiry to download and prepare a
dataset from Daymet.
- Students spend 10-15 minutes exploring the data to help
narrow their research question. Students record their
research question in their science notebook.
- Instructor supports the open inquiry process by circulating among groups and encouraging students to pursue researchable questions (e.g., those that can be answered with the available resources and tools).
- Use the Weather to Climate Investigation: Open Inquiry handout for suggestions on how to begin analyzing the data.
- Students record findings and observations in their Science Notebook.
- WRAP-UP: Student groups share findings with
classmates using chart paper to create a mini poster, or
doing a brief presentation. For more ideas on communicating
findings, see the GLOBE Carbon Cycle Communicating
Findings and Results page.
Assessment
- Use the Teacher Version with example responses to assess the completeness of student work.
- Have students informally report out to the class on the overall results/trends of their study.
* Data from Daymet. Thornton; P.E.; M.M. Thornton;
B.W. Mayer; N. Wilhelmi; Y. Wei; R. Devarakonda; and R.B.
Cook. 2014. Daymet: Daily Surface Weather Data on a 1-km
Grid for North America; Version 2. Data set. Available
on-line [http://daac.ornl.gov] from Oak Ridge National
Laboratory Distributed Active Archive Center; Oak Ridge;
Tennessee; USA. Date accessed: 2014/07/04. Temporal range:
1980/01/01-2013/12/31.
http://dx.doi.org/10.3334/ORNLDAAC/1219