
Part 2: Local
and Global Future Climate Data
Guiding
Questions: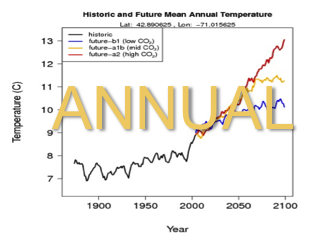
- Will the weather and
climate patterns I observed in the local data continue
into the future?
- How do local climate
patterns compare to other regions of the world?
Definitions:
- Global Climate Models
= evaluate the physical processes occurring throughout the
Earth's land-ocean-atmosphere system. Generate predictions
extending 100 years into the future.
- Emission Scenarios = Characterize the heat-trapping gasses that we expect to find in the atmosphere based on different scenarios describing future trends in population growth, energy use, economic development, and technology use. For more information on models and emission scenarios see information from the World Meteorological Organization.
- Anomaly = the departure from the average climate over a certain period. For example, a positive temperature anomaly indicates that the observed temperature is warmer than the average climate, while a negative anomaly indicates that the observed temperature is cooler than the average climate.
Materials:
- Computers with access to the internet (one per student or student pair)
- Science notebook for recording observations (Guided Inquiry only)
- Climate Investigation document

Pre-
requisites
- Part 1 of
this sequence or other experience manipulating weather
data.
Estimated Time:
- 1 hour
What to do and how to do it
- INTRODUCTION As a hook, watch video(s) from the 'How Do We Know?' series on the Science 360 website- particularly, 'How Do We Know? The Warming of the Earth' ~1 min 20 sec). If your students have not studied climate change, use the Temperature Anomaly Animation to introduce the topic (see above definition of 'anomaly'). What trends do they notice? What areas might experience a greater temperature change?
- Navigate to the Data Tools page. Instructor gives a brief tour of the tools that students will be using (Climate Maps, Animations, Single Site Climate Data tool).
- In pairs, or individually, students follow the instructions on the Climate Investigation handout to explore climate change in their location of interest. The Structured experience directs students to specific data and provides spaces for recording trends. The Guided experience offers students options for data collection, and an opportunity to design a means of recording trends in the science notebook.
- (Optional) Complete the Extension part of the Climate Investigation, which asks students to compare their location to another location around the world by using Climate Comparison Google Motion Charts (**Note: this application needs java to run, and therefore will not work on an iPad).
- WRAP-UP: Students share the results of their investigations with the class in either an informal or formal presentation. What questions do they still have? What would be the next step of their research?
Assessment
- Use the Teacher Version with example responses to assess the completeness of student work.
- Use the GLOBE Carbon Cycle Communicating Research Findings webpage for further resources and assessment ideas for student presentations, writing , and posters (guides, examples, sample rubrics, etc.)