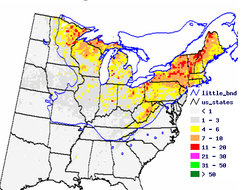
Part 3: Tree Atlas Tool and Expected Changes to Tree Species Abundance
Guiding Question:
To what extent will climate change impact suitable habitat of the abundant tree species identified in your forest plot?
Background:
 The Tree Atlas tool
assesses the current status and potential future status
following climate change, of 134 tree species in the eastern
United States. The Tree
Atlas tool uses US Forest Service inventory data with
38 environmental variables to generate models of current
suitable habitat for each species. The Tree Atlas tool
then changes the climate according to three climate models
and two emissions scenarios, and model the potential future
species habitats.
The Tree Atlas
presents species abundance according to the potential
suitable habitat. This is not necessarily where the trees
will actually be at the end of the century, as there are
often great lag times in tree migration, but simply the
predicted location of where the best habitat for that
species will be.
For more information, see the Tree Atlas website or the Tree
Atlas Screencast Tutorial.
Definitions:
- FIA = Forest Inventory and Analysis conducted by the US Forest Service
- Abundance = the
relative representation of a species in a particular
ecosystem.
- Importance Value (IV) = a relative abundance measure that combines relative density and basal area per species. Ranges from 1 to 100 (a monotypic stand= 100).
Materials (one per student):
- Pencil, Science Notebook (*for Guided Inquiry experience)
- Computer with access to the Internet
- Tree Atlas Investigation document
- Tree Atlas Procedure

Pre-requisites:
- This tool ONLY works for studies in the Eastern US. If your study location is elsewhere, then skip this part of the sequence.
- The Instructor will benefit from viewing the Tree
Atlas Screencast Tutorial and exploring the Tree Atlas tool before students
utilize it.
Estimated Time:
- 1 hour
What to do and how to do it:
- INTRODUCTION: Background provided on the Tree Atlas tool. A quick tour of the tool is presented, or watch the Tree Atlas Screencast Tutorial.
- Students individually explore the Tree Atlas tool (use Tree Atlas Procedure handout).
- Once students are acquainted with the Tree Atlas tool, they return to the research question they developed in the Investigating Climate Data handout concerning climate change and the 2-3 abundant tree species in their field plot.
- With a partner, Students refine their research question to explore the overarching question: to what extent will climate change impact suitable habitat of the abundant tree species identified in your forest plot?
- Students use the Tree Atlas tool to investigate their
research question. The structured inquiry experience directs
how students apply the Tree
Atlas tool and how the data are recorded. The
guided inquiry experience provides students an opportunity
to design their own investigation plan, data tables, and/or
graphs.
- Instruct student groups to use chart paper to report revised question and major findings.
- WRAP-UP: Some student groups share findings with classmates using the chart paper as a mini-poster.
