
Vegetation Index Learning Sequence
Focus:
Interactions between vegetation and climate through the study of vegetation indices and the analysis of digital images.
Rationale:
The analysis of digital images and remotely sensed data is central to contemporary monitoring of our planet. Because these data are often collected by satellites, or other sophisticated monitoring equipment, they are usually presented to students in an intangible manner that does not engage them in the collection or analysis. The Vegetation Index Learning Sequence uses Picture Post as a bridge to understanding the fundamental aspects of collecting images and analyzing them digitally. Students begin by collecting and analyzing their own (or provided) digital images, and then move on to the analysis of satellite imagery by studying patterns in NDVI, a vegetation index that measures the "greenness" of a surface. The Learning Sequence culminates with a student-directed research investigation that relates to the interactions between vegetation and climate.
Part 1.
Set up a Picture Post
Part 2. Analyze Picture Post photos by calculating a Greenness Index over time and comparing different features in the images.
Part 3.
Use the Picture Post Animation to compare photos,
vegetation indices, and albedo, and to
consider different scales of data collection.
Part 4.
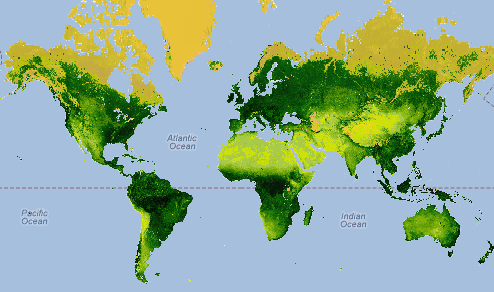
Explore seasonal changes in a MODIS vegetation index (NDVI) in
two contrasting locations.
Part 5.
Conduct a literature and data research investigation about
vegetation and climate interactions, and write a research
report.
***
After learning about local and global seasonal vegetation
patterns, as well as data collection from local to global
scales, this learning sequence can lead nicely into the
concepts of albedo, biomes, or biomass accumulation (See other
available Learning Sequences on the Teacher
Resources main page).