
Part 4: Explore Seasonal Changes in NDVI
Guiding Question:
How does NDVI change over time in two
different locations?
Definitions: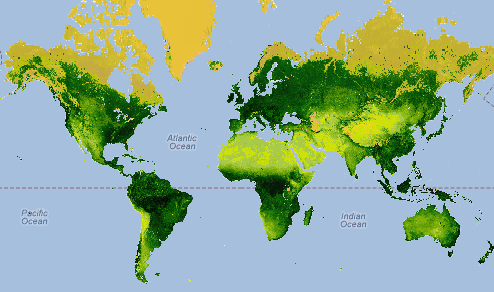
- NDVI = the Normalized Difference Vegetation Index also measures the greenness of an area, but is calculated using a combination of infrared and red bands. It is often measured by Earth observing satellites with instruments such as MODIS (the Moderate- Resolution Imaging Spectroradiometer). For more information on NDVI, see NASA's Measuring Vegetation website.
Materials:
- Computer with access to the Internet
- Pencil and Science Notebook (for Guided Option)
- Seasonal Changes in NDVI
handout

Estimated Time:
- 1.5 hours
What to do and how to do it:
- INTRODUCTION:
Watch the NDVI Animation and have
students discuss their observations of changes in NDVI
across space and time. How does the northern hemisphere
differ from the southern hemisphere? Where is there the
greatest seasonal change in NDVI? Are there places that have
a relatively constant NDVI?
- Instructor poses the guiding question (How does NDVI change over time in two different locations?) and solicits students’ ideas on what information/data they would need to answer that question.
- Navigate to Carbon Mapper using the instructions on the Seasonal Changes in NDVI handout.
- Instructor provides a brief tour of the Carbon Mapper (See
the
Carbon Mapper Features document in the side panel for a general overview). - Students continue to follow instructions on the Seasonal Changes in NDVI handout to find seasonal NDVI for two contrasting locations. Note: Handouts instruct students to use data from 2013, however data from any year may be used. If students encounter missing data at the lat/lon they chose, have them choose a nearby location with complete data.
- WRAP-UP: Students pair-share the differences in seasonal NDVI they observed between the locations they chose. Discuss any questions students have regarding the activity or concepts.
Assessment
- Use the Checklist for Student Work, or your own rubric, to assess the quality of student work.
- Have students either informally report out to the class on the overall results/trends of their study (orally or using chart paper, the smartboard, etc.) or create a formal report. For suggestions, rubrics, and examples of formal reports, see the GLOBE Carbon Cycle Communicating Findings page.