
Part 3: Linking Picture Post Images to MODIS data
Guiding Question:
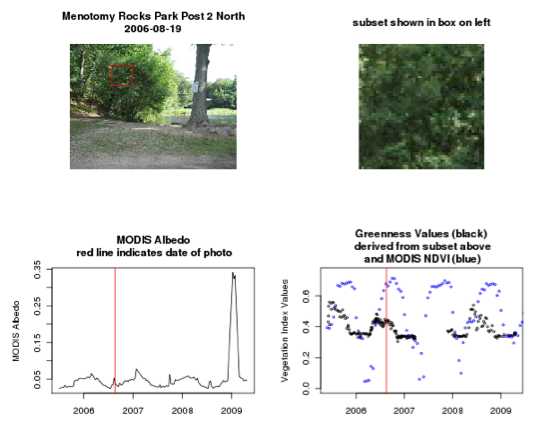
How do Picture Post images compare to
corresponding MODIS images, and what potential variables might
affect the correlation between these two data sources?
Definitions:
- MODIS = The MODerate resolution Imaging Spectroradiometer is a scientific instrument launched by NASA that captures data in 36 spectral bands. It images the entire Earth every 1 to 2 days. For more information see: http://modis.gsfc.nasa.gov.
- Albedo = the fraction of incoming solar radiation that is reflected back into space.
Materials (one per student):
- Computer with access to the Internet
Estimated Time:
- 20 minutes
What to do and how to do it:
- INTRODUCTION: If students are not familiar with albedo, briefly introduce the concept (see the Albedo Learning Sequence page for ideas and introductory materials, e.g. the Introduction to Albedo handout). Discuss what a satellite is, and why satellite data are useful (see NASA's What is a Satellite resource *could assign this page as a prior homework assignment). Ask students: when would it be helpful to use satellite data? When would it be useful to use data from Picture Post? (Think about the difference in scale: Picture Post shows much more detail, and pictures may not be taken every day; satellites cover a much broader area and are more temporally consistent in their data collection).
- Open the Picture Post Animation.
- When you open the page, the animation will begin playing—watch it play for a few minutes to get a feel for how the graphed data relates to the two images as they progress through the seasons. Next, you can use the controls to change speed, freeze images, or move around throughout the date range.
- Use the animation tool to explore the relationship between albedo and greenness and NDVI. How do the high and low values of each variable compare to one another? How do they relate to the Picture Post images?
- WRAP UP: Have students answer the guiding question (How do Picture Post images compare to corresponding MODIS images, and what potential variables might affect the correlation between these two data sources?) in their science notebooks.